Humans come in all sizes, height, weight and body type whenever you look at any gathering of people, children or adults. But given this natural variations, how do you know whether your children are growing normally or not? What are the possible signs and symptoms if something is not right, and when should you be worried? Read on to find out more.
Average Child Height and Weight Chart at Different Ages
All children grow at different rates. Growth rates depend on many individual aspects of a child's life, including both genetic and environmental factors. To help determine whether a child is growing at an average rate in both height and weight, pediatricians refer to height and weight charts for children at a particular age. Here are the average child height and weight chart at different ages.
Height and Weight Chart for Babies (0-11 months):
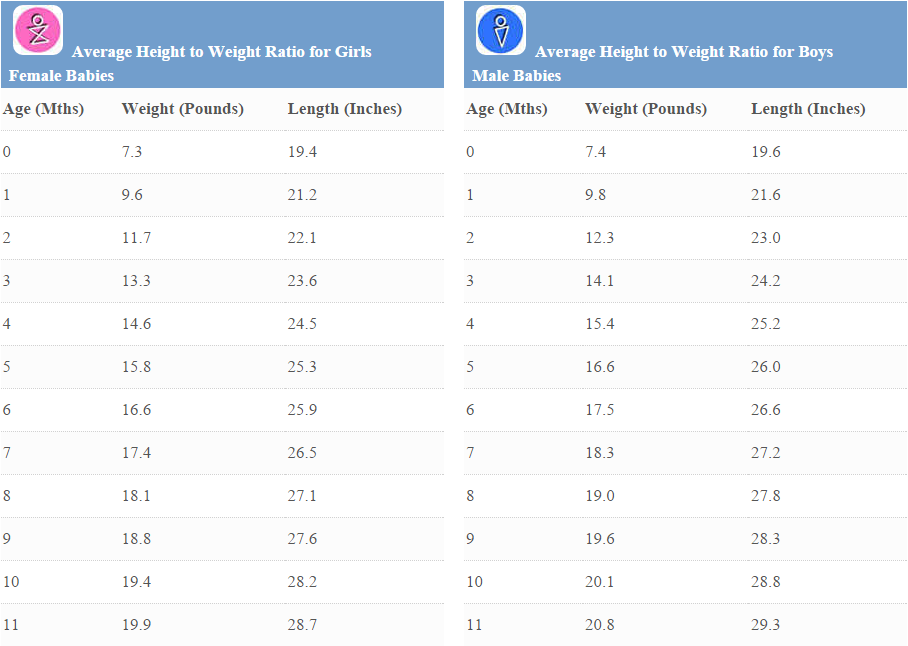
Height and Weight Chart for Toddlers (12-23 months):

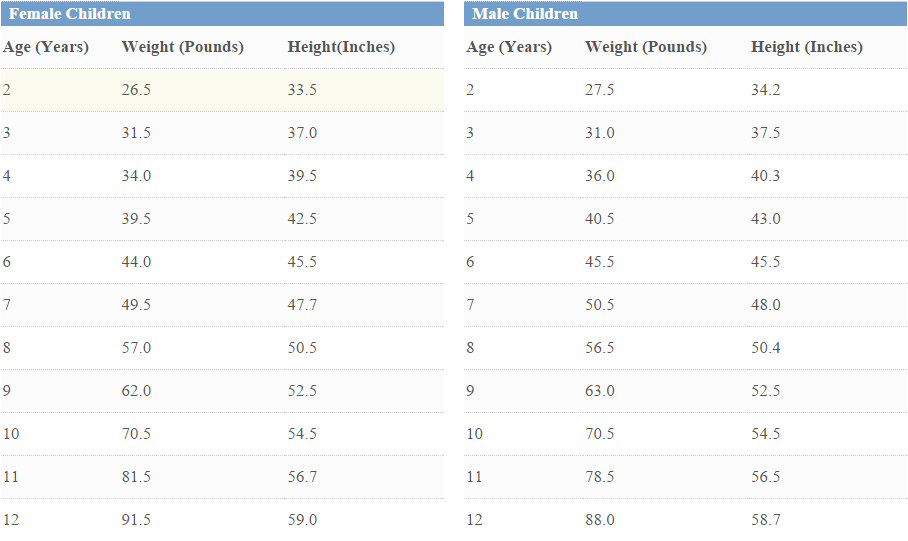
Height and Weight Chart for Children (2-12 years):
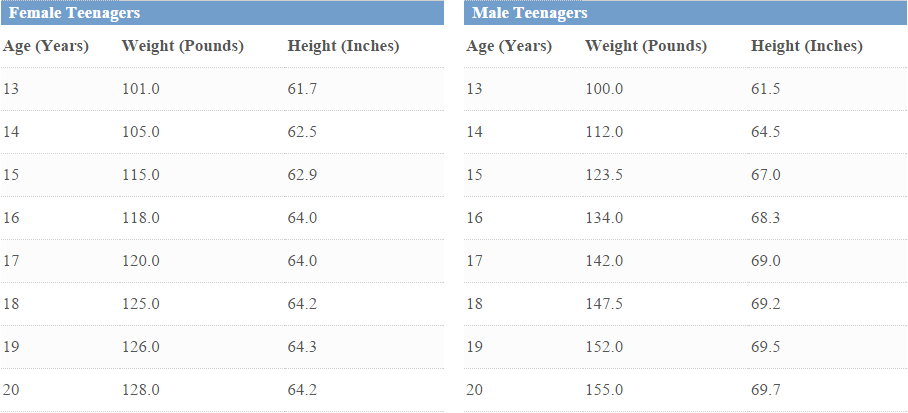
Height and Weight Chart for Children (13-20 years):
How Can I Tell If My Child Is Overweight?
To compare children to others in their age range, doctors use body mass index (BMI) and percentiles. The BMI figure indicates how your weight compares with your height, giving an approximate indication of whether you are over- or under-weight. The BMI is calculated using the following equation:
BMI = Weight/Height2
After BMI is calculated for children and teens, it is expressed as a percentile which can be obtained from either a graph or a percentile calculator. Because weight and height change during growth and development, as does their relation to body fatness, a child’s BMI must be interpreted relative to other children of the same sex and age.
For instance, a boy in the 40th height percentile will be taller than 40% of other boys at his age. A girl in the 70th weight percentile will be heavier than 70% of girls her age.
Generally speaking, the higher your BMI above the normal range, the more overweight you are. However, BMI is only an approximation, and does not take into account muscle mass or natural body shape variation.
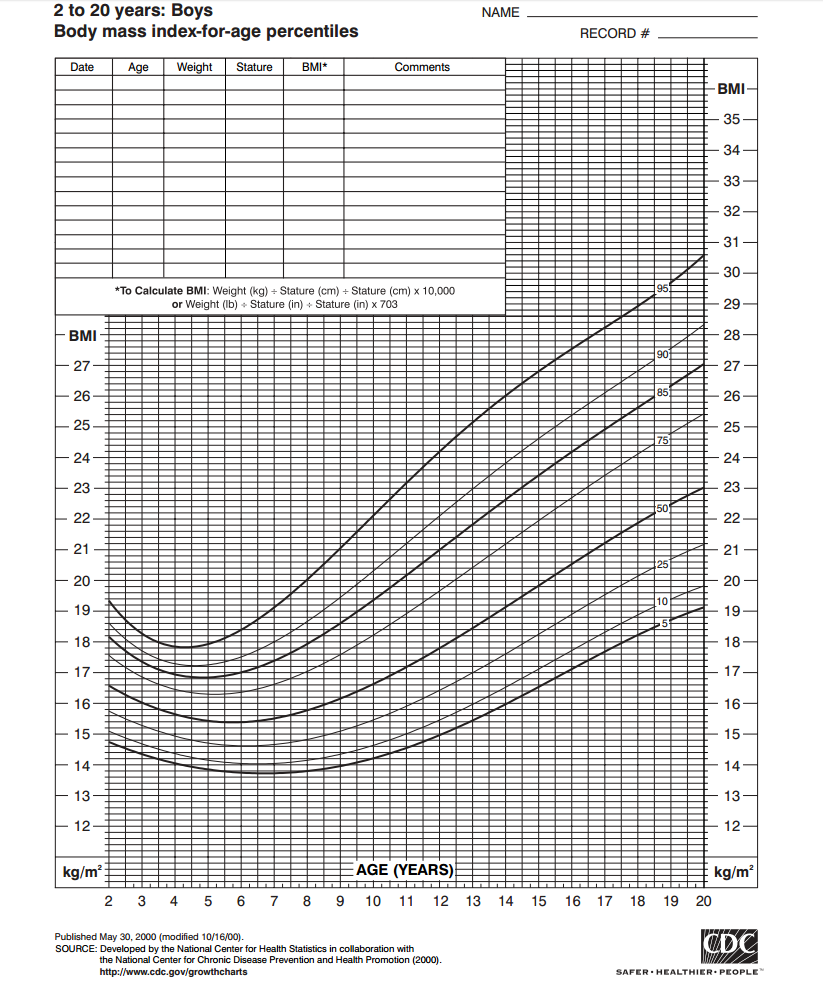
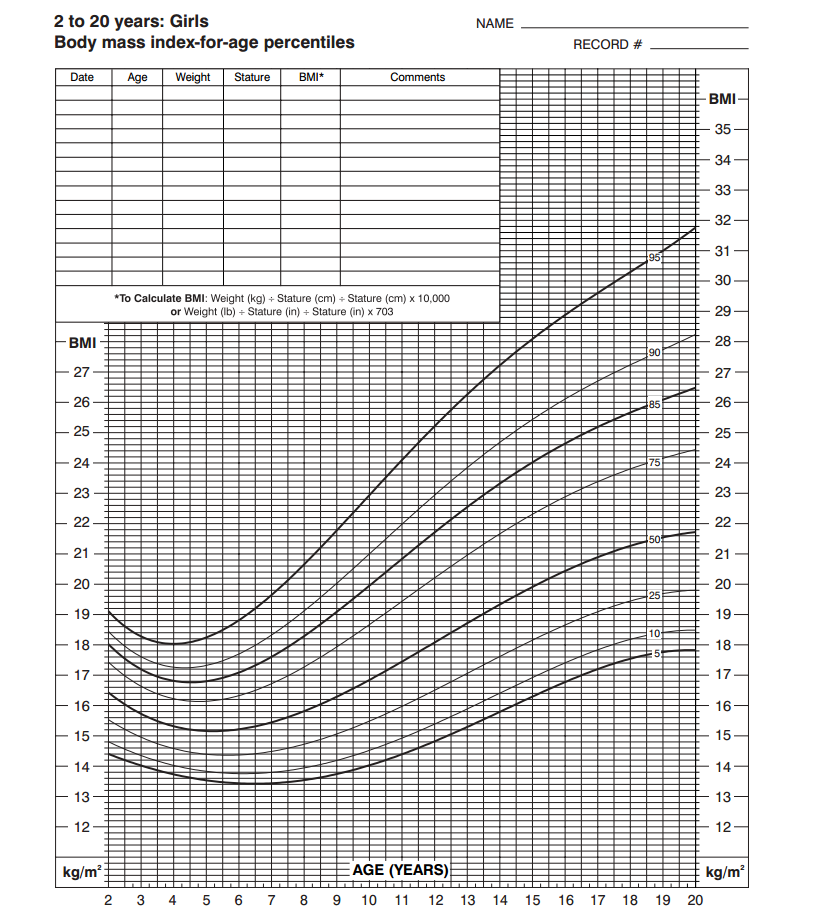
The BMI-for-age percentile growth charts are the most commonly used indicator to measure the size and growth patterns of children and teens in the United States. BMI-for-age weight status categories and the corresponding percentiles were based on expert committee recommendations and are shown in the following table.
|
Weight Status Category |
Percentile Range |
|
Underweight |
Less than the 5th percentile |
|
Normal or Healthy Weight |
5th percentile to less than the 85th percentile |
|
Overweight |
85th to less than the 95th percentile |
|
Obese |
Equal to or greater than the 95th percentile |
Things You Need to Know When Using Child Height and Height Chart
Although BMI is used to screen for overweight and obesity in children and teens, BMI is not a diagnostic tool. To determine whether the child has excess fat, further assessment by a trained health professional would be needed.
Besides, there are a few more things you need to know about the child height and weight chart:
- It’s easy to make measurement mistakes; for instance, if the child is not standing up straight when assessing height, or if a baby wriggles on the scales.
- Each measurement is only a snapshot of that particular time point, and may not reflect the overall picture of your child’s growth. For example, if your child has recently had diarrhea, he or she may be underweight for a while, but will probably soon return to a healthy weight.
- The range of heights and weights considered “normal” is actually quite big. Therefore, if your child is in say, the 13th weight percentile (indicating that 87% of children are heavier), this won’t necessarily mean he or she is unwell or malnourished. The child could just be naturally small for his or her age.
- The measurements only give an indication of how your child is developing and won’t necessarily predicate his or her adult height and weight.
Nevertheless, there are some changes in growth patterns that may indicate an underlying issue, so will require further investigation:
- If one of your kid’s measurements are consistently above the 90th percentile or below the 10th percentile for his or her gender or age.
- If the measurement does not remain close to one of the growth lines on the graph. For example, a medical professional may be concerned if a one-year old child’s weight was in the 70th percentile, then decreases to the 30th percentile six months later.
However, it’s important to remember the unusual growth patterns on the child height and weight chart are only an indication of possible issues. Medical professionals will be able to assess if there is a real medical condition, or whether your kid’s growth just requires careful monitoring.
For more information about the height and weight chart, visit CDC Growth Charts or WHO Child Growth Standards.